Google Sheets as a Database for a Dashboard App?
Yes, you heard that right! We’re not using MongoDB, SQL, or anything like that, but good ol’ Google Sheets. But why on Earth would you use something like that?
Below is the Google Sheets we use for our database and it is currently populated with simple attendance figures next to people’s names describing what time they attend and whether it is offline or online. However, several team leaders had to create and summarise reports based on their team’s attendance and send it to Telegram which was often tedious.
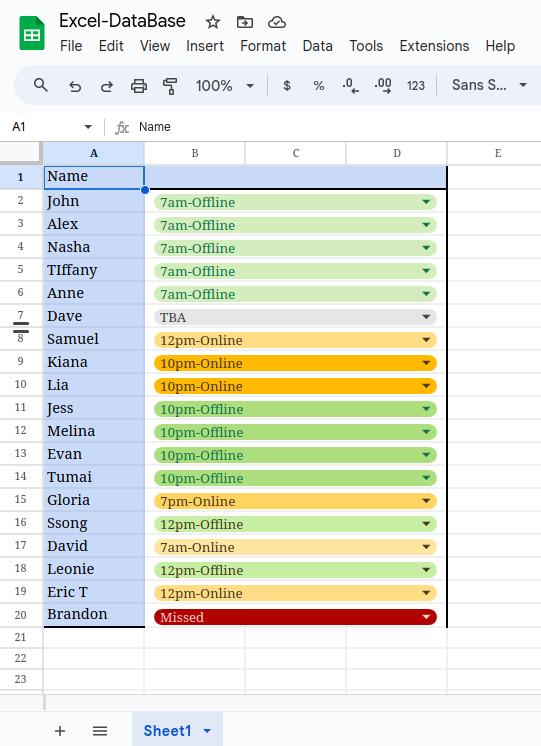
This is what led me to using our excel as a database so that it could be connected to a data visualiser that pulls data from it. After some configuration and application setup, we can just call the Sheets API to use on a frontend. In this case, I have used a simple React project with Material UI components to build a dashboard that can display all the information according to how we see fit.
So below we see a pie chart representing the attendance figures from our spreadsheet database along with a calculated offline attendance percentage.
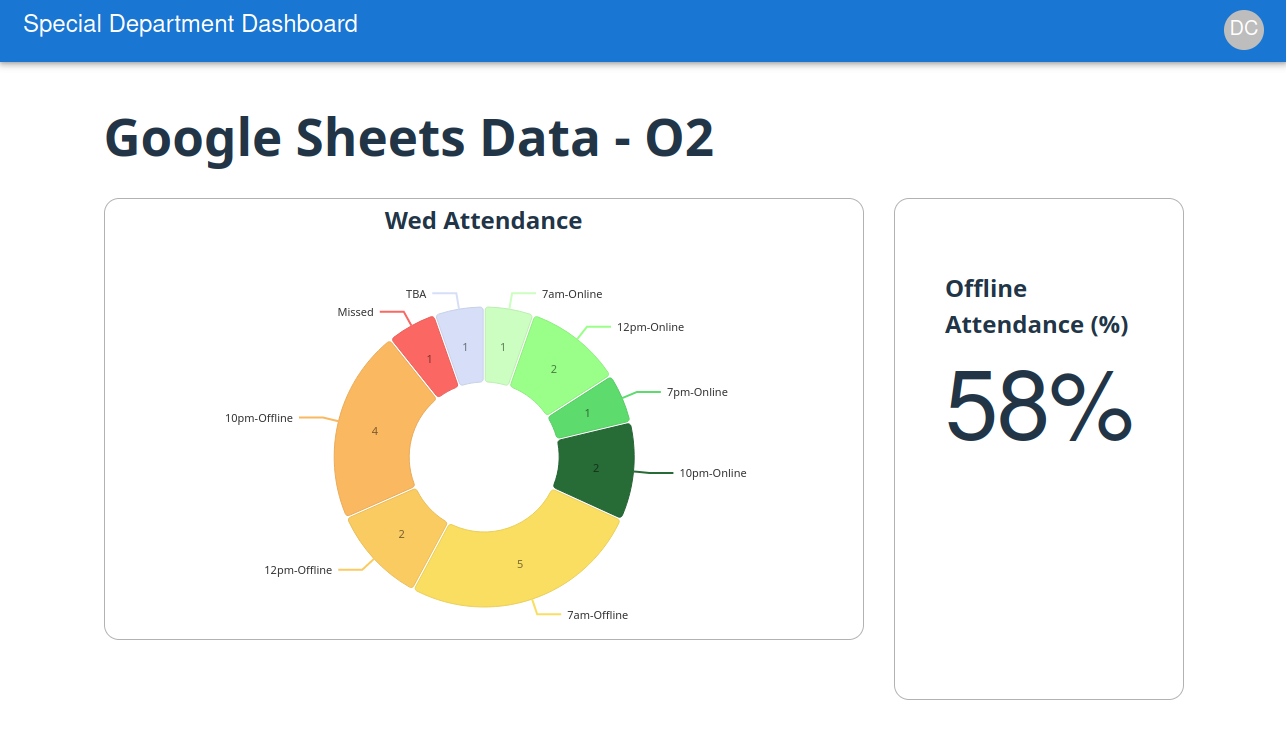
You can view the Dashboard here
Realisation on how to make Internal Tools that are Adopted
In my organisation, I’ve witnessed several people with backgrounds in software engineering who volunteered to develop some chatbots, mobile apps and other nifty things to attempt to help workflows for people. However time and time again, I’ve seen people initially praising the idea and then it just simply fizzled out. No one bothered to use it since it required a lot of maintenance for the devs or it was just cumbersome as a user experience. So it made me ponder about what aspects of an application make a great internal tool that becomes adopted.
- I first started thinking about what applications are being used in the organisation. In my case it was Telegram and Google Sheets.
- Then I had to consider how willing people are to change their app choices, but in this case it was a very hard NO.
- I then had to plan how to develop an application that didn’t interfere with people’s work flow at all and in this case feel very invisible.
If it felt invisible when I interacted with it, then any output that the application made will almost always feel like a net positive in the uers’s perspective.
That’s what can make Google Sheets a great choice for a database. In this case, the user can just stick to what they are used to and enter excel data as they always did. But they get the added benefit of being able to visit a Dashboard that they don’t need to manage. So in their perspective, they just input excel data as normal and then click on a website. Absolutely no fuss or perceived extra steps with their workflow. Invisible…
Interesting Idea
To go even further, whenever you use Google Forms, the results are stored into a spreadsheet. Then with this method, we can create a system where users are able to input data through a google form, then the data in the Sheet can automatically be called to some kind of frontend app to visualise data or provide statistical analysis.
Maybe you want to survey your employees and use the Google Form data in a Dashboard? I can leave this idea with you to try out.
How to Implement the Google Sheet Database
The method of creating this Database is based on this YouTube Short. I have summarised the steps below.
How to create Google Sheets as a Database
- Go to Google Sheets and create a new blank sheet
- Add some data
- Click on “Extensions” dropdown and click on “Apps Script”. This will take you to a new window where there is an interface to add in JavaScript for Apps Script
- Copy paste the following code into the coding interface:
const doc = SpreadsheetApp.getActiveSpreadsheet();
let sheet = doc.getSheetByName("Sheet1");
let value = sheet.getDataRange().getValues().slice(1)

function doGet() {
  return ContentService.createTextOutput(JSON.stringify({data: value})).setMimeType(ContentService.MimeType.JSON)
}
If you want to have more control on what values you are getting from the sheet, then you can read the docs regarding the “SpreadsheetApp” class.
- Click on “Deploy” drop down and click “New deployment”
- Add a description, Execute as “Me” and have “Only myself” for who can access the app
- Click “Deploy”
- Copy the “Web app” URL. This is the URL that you use to make fetch requests and receive the data as specified in our Apps Script code.
- Lastly, integrate into frontend by making a call using this Web app URL. E.g
const res = await fetch(*Web-app-url*);
// do something with res on the frontend
Installation
If you want to run my React/TypeScript Dashboard with a spreadsheet of your own, then follow the below steps.
- Clone the repository
git clone git@github.com:daveanthonyc/Excel-DB.git- Go into directory
cd Excel-DB- Install dependencies
npm install- Create .env file with this variable referencing your Web App URL:
VITE_GOOGLE_SHEET_WEB_APP_URL="**Your Web app URL from beforehand**"